Blogs
Comparing VR headsets’ tracking performance
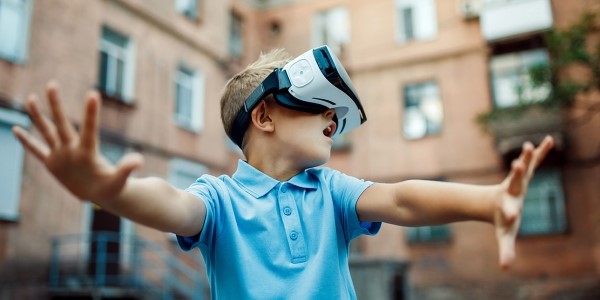
Consumer VR headsets have been available since 2015, when a large number of companies announced their own versions of the products. By 2016, more than 230 companies were working on their own VR HMD projects. Most of these projects have since ended and companies have gone bankrupt, but some keep releasing new products, both stand-alone and tethered versions, on an almost annual basis. Oculus (Facebook) released new Quest and Rift devices in 2019, while HTC came up with a new VIVE and Valve announced their Index glasses. Then there is Varjo, a company that keeps amazing their fans with human-eye resolution products, as well as numerous new Chinese companies that are also catching up fast in product design and performance. In CES 2020, there were dozens of new players and products coming to both the VR and AR markets. [1] [2]
While we have all these awesome new products available, the actual sales figures also tell an interesting story. To this day, the biggest market share of VR headsets belongs to Sony. Sony announced their Project Morpheus (PSVR) in 2014 and released it in October 2016. By March 2019, PSVR had sold more than 4.2 million units. According to SuperData’s Q4 2018 XR market report, Sony’s PSVR became the market leader with sales of 700,000 units — the largest number of headsets sold across any category. By comparison, the standalone Oculus Go has sold 555,000 units, with the tethered Oculus Rift and HTC Vive selling only 160,000 and 130,000 units, respectively. [3][4][5]
How did Sony do this? It’s obvious that the PS4 ecosystem and the ease of accessing VR content play a big role in this. Most of us tech geeks would still like to know how the PSVR performs in terms of tracking and image quality, since these are the main factors that define the HMD quality. There are a lot of good news articles and blogs in the web that break down the fundamentals of AR/VR HMD immersion and the technological challenges in meeting the standards of today and the future. For further reading, we recommend checking out UploadVR, NextReality, RoadtoVR, Daniel Wegner’s article and Steven Lavalle’s book Virtual reality.
OptoFidelity has been designing and building testing and calibration systems for VR/AR products and components for years. These systems cover solutions for movement tracking accuracy and latency as well as for optics and image quality. Recently, Oliver Kreylos did a great review of PlayStation’s VR headset FOV and resolution. We wanted to contribute to this and run some tests to see whether PSVR’s tracking performance stands up against some other popular headsets in the market. [6]
Test setup
Our measurement setup consists of OptoFidelity BUDDY-3 equipment and several VR headsets including Sony PSVR, HTC Vive, Oculus Quest and Valve Index. OptoFidelity BUDDY-3 tests the head tracking performance of VR/AR headsets using a robot, a smart camera and signal processing algorithms that allow determining the orientation of the virtual content in a non-intrusive manner by just imaging the display. The absolute tracking method is covered in detail in a blog post on the OptoFidelity website.
When the robot moves the headset, the robot’s actual motion is captured by an encoder counter device which is synchronized to the same clock as the camera. This allows temporal comparison of the content and robot orientation signals and calculating the motion-to-photon latency.
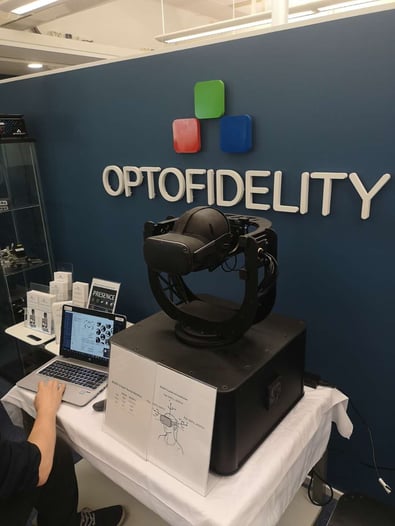
Figure 1: OptoFidelity Buddy-3 test setup
Drift testing
Drifting means how well the headset can anchor itself to the environment or given position. Typically this tells how successfully SLAM (simultaneous localization and mapping) has been done.
The robot was moved to random positions at full speed for one minute. This was repeated 15 times with a 10-second pause between each run. The images on the figures show the drift on each axis at the end of the 10-second pauses.
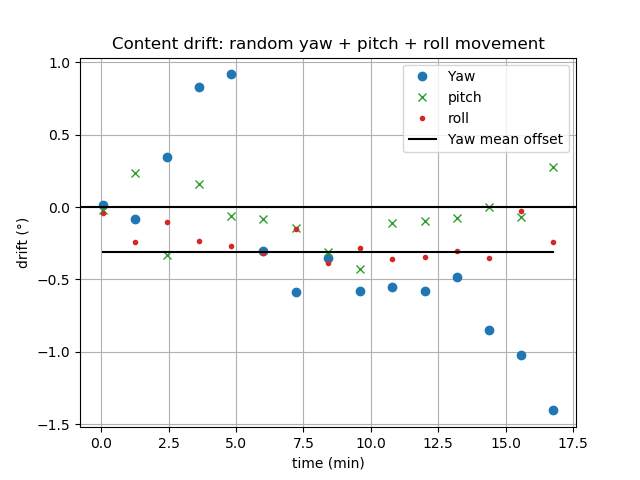
Figure 2: Sony PSVR
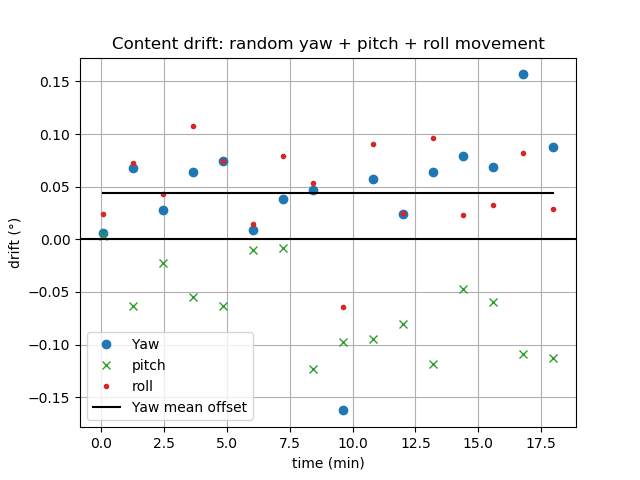
Figure 3: HTC Vive
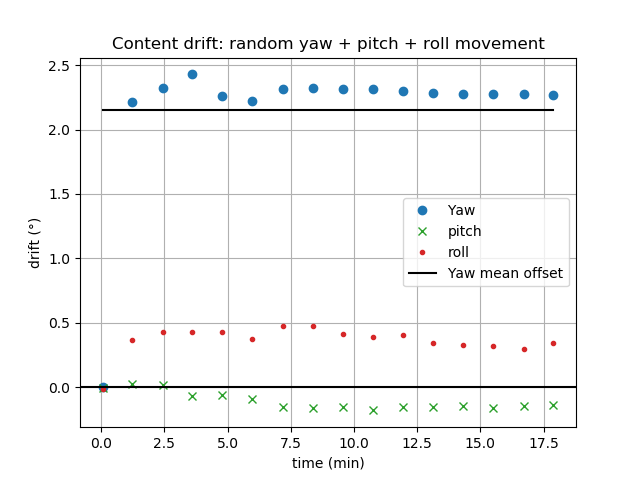
Figure 4: Oculus Quest
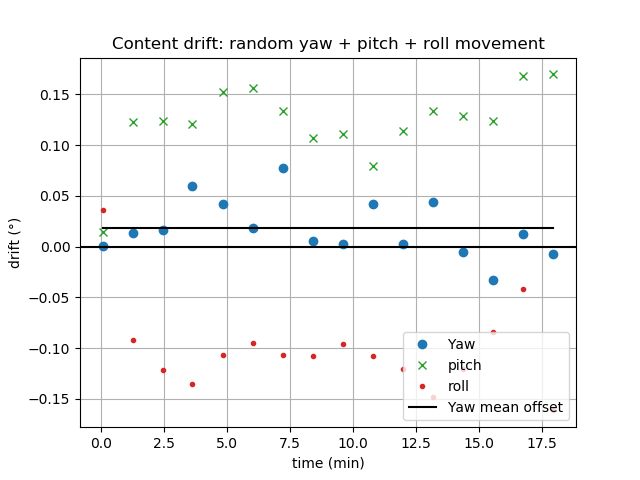
Figure 5: Valve Index
Jitter and stationary jitter
Jitter and stationary jitter are typically caused by inaccurate sensor data or in most cases problems within the motion prediction algorithms. The user can perceive it as an unstable or vibrating image while moving or staying still. Jitter and tracking error can be visualized by plotting the difference of the virtual world pose to the real-world robot pose.
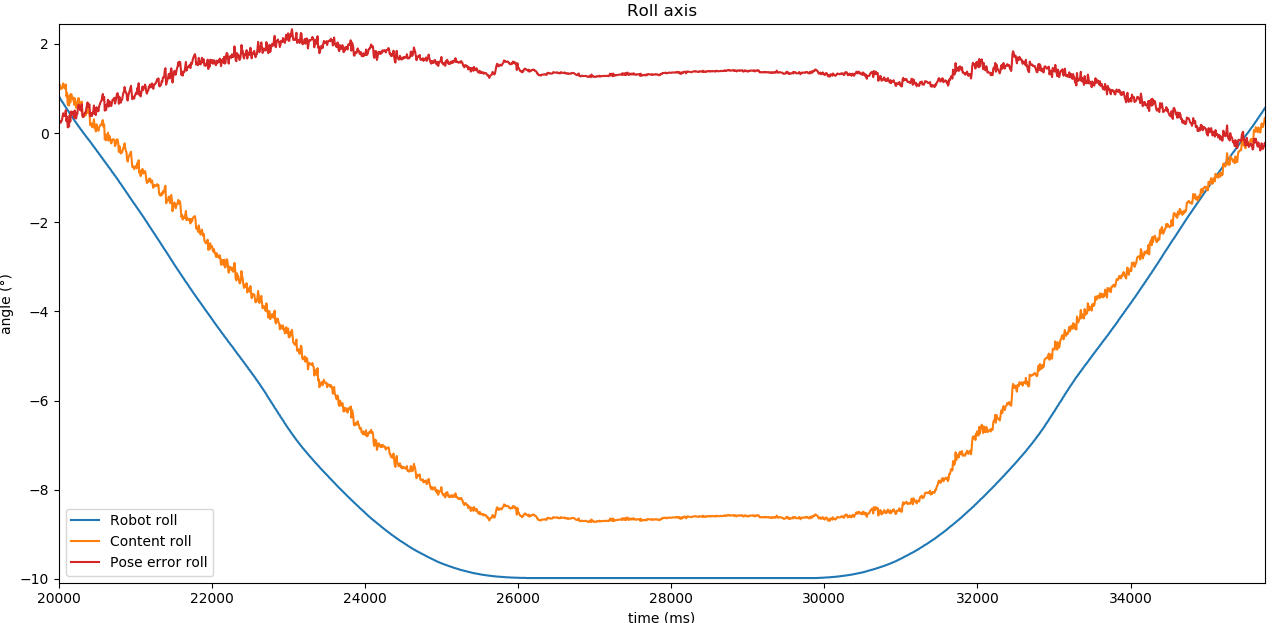
Figure 6: Sony PSVR
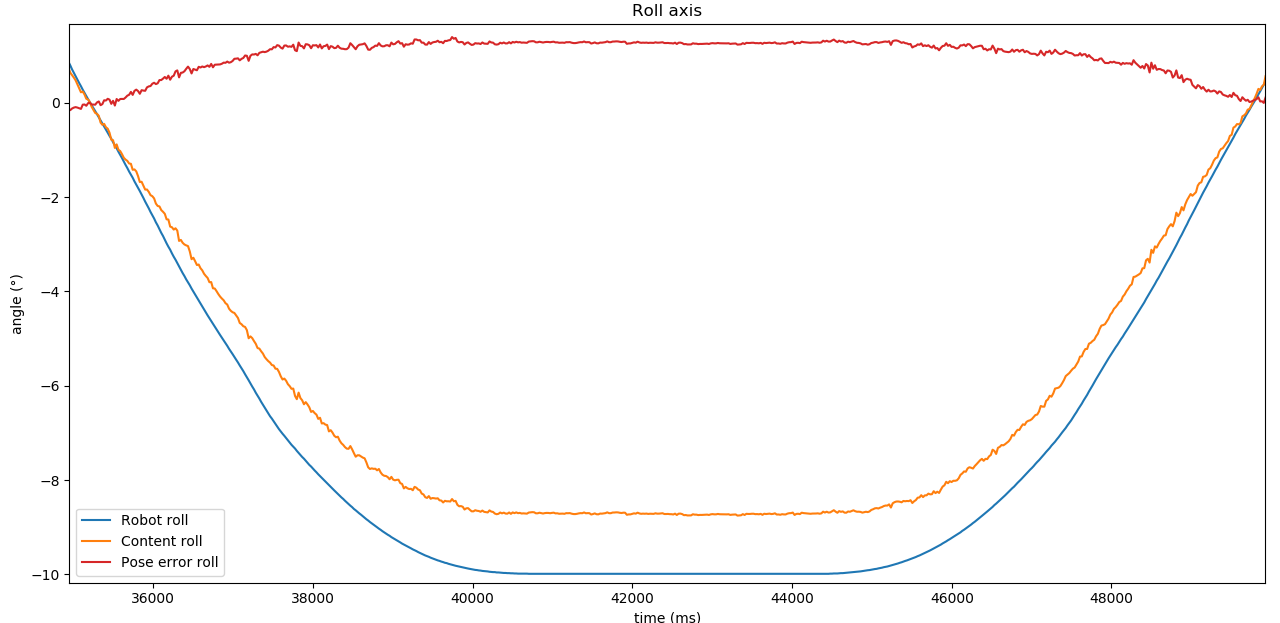
Figure 7: HTC Vive
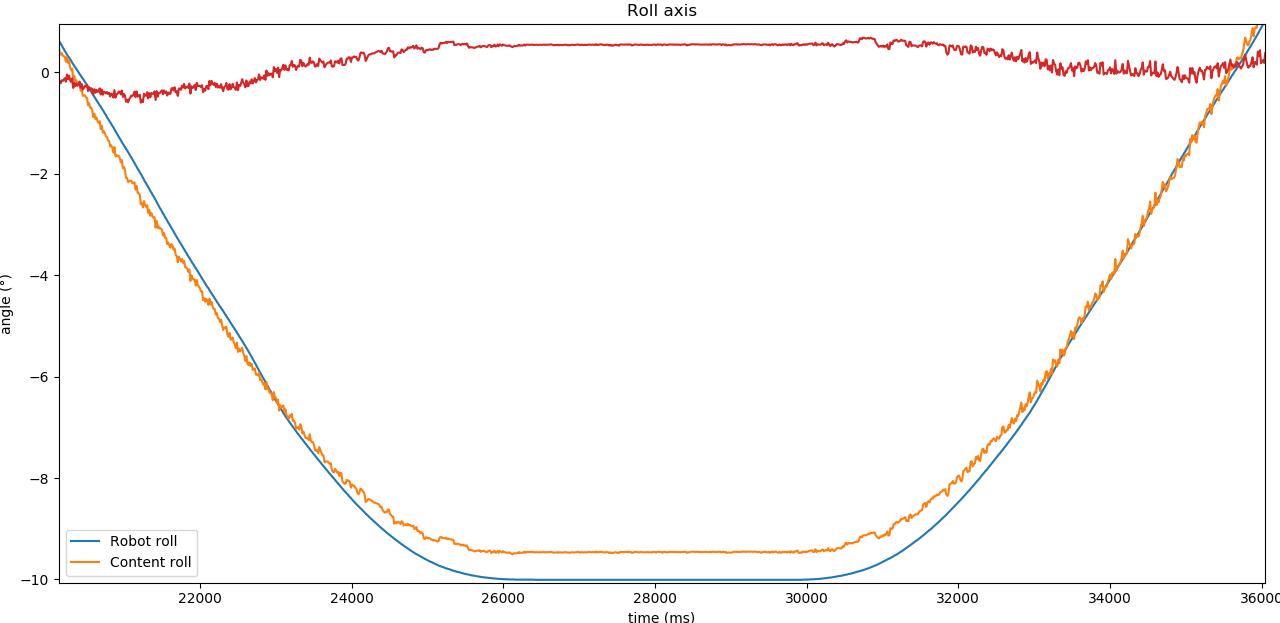
Figure 8: Oculus Quest
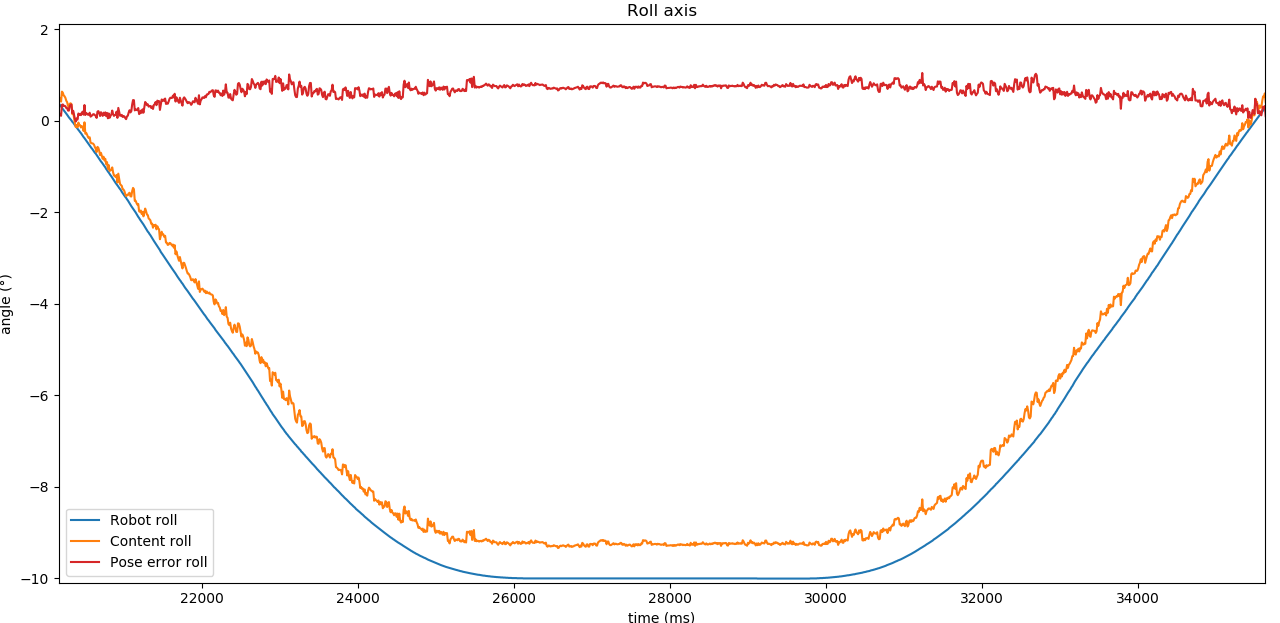
Figure 9: Valve Index
Stationary jitter
The robot was kept still for one minute and then moved.
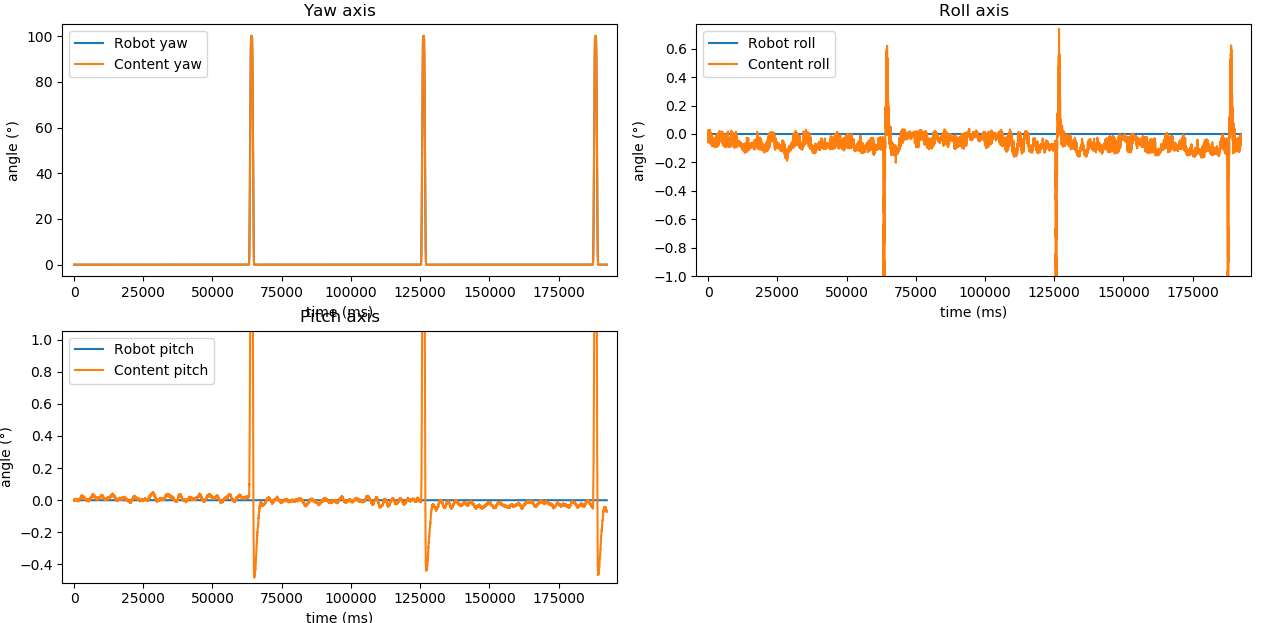
Figure 10: Sony PSVR
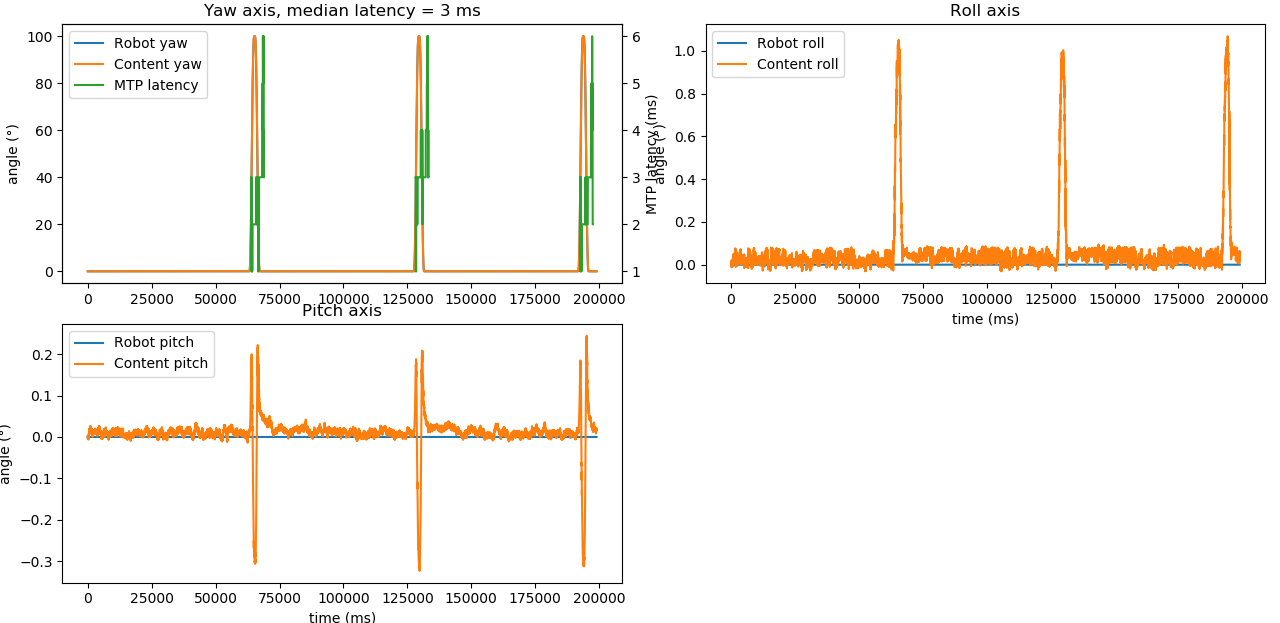
Figure 11: HTC Vive
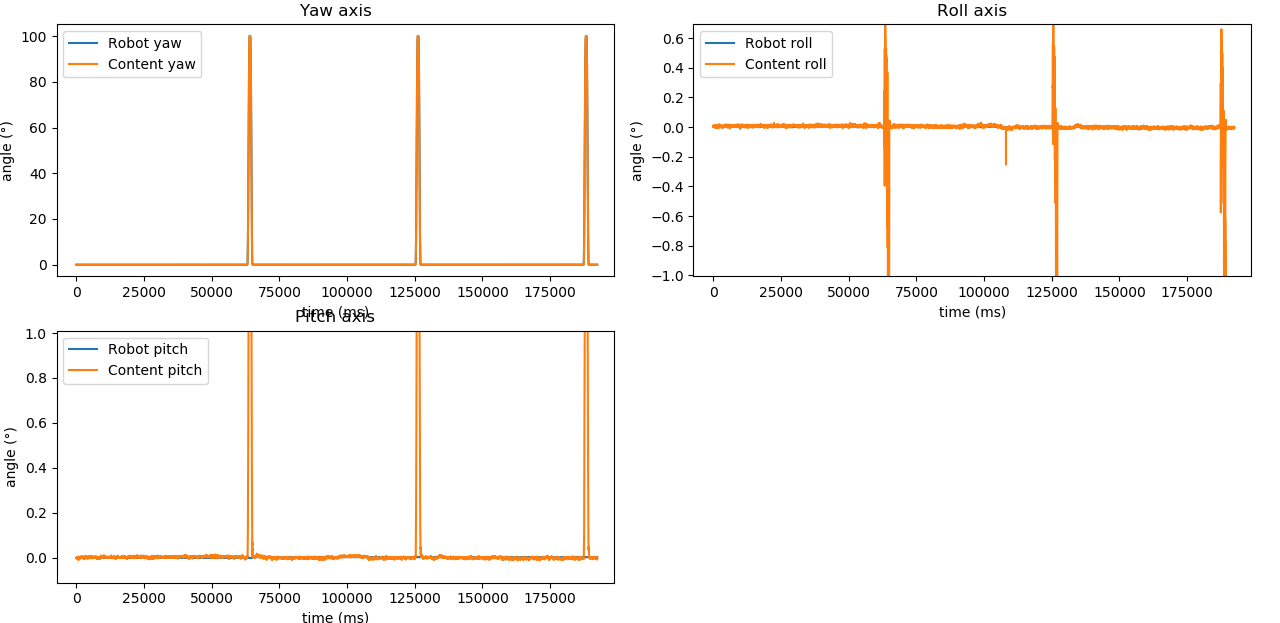
Figure 12: Oculus Quest
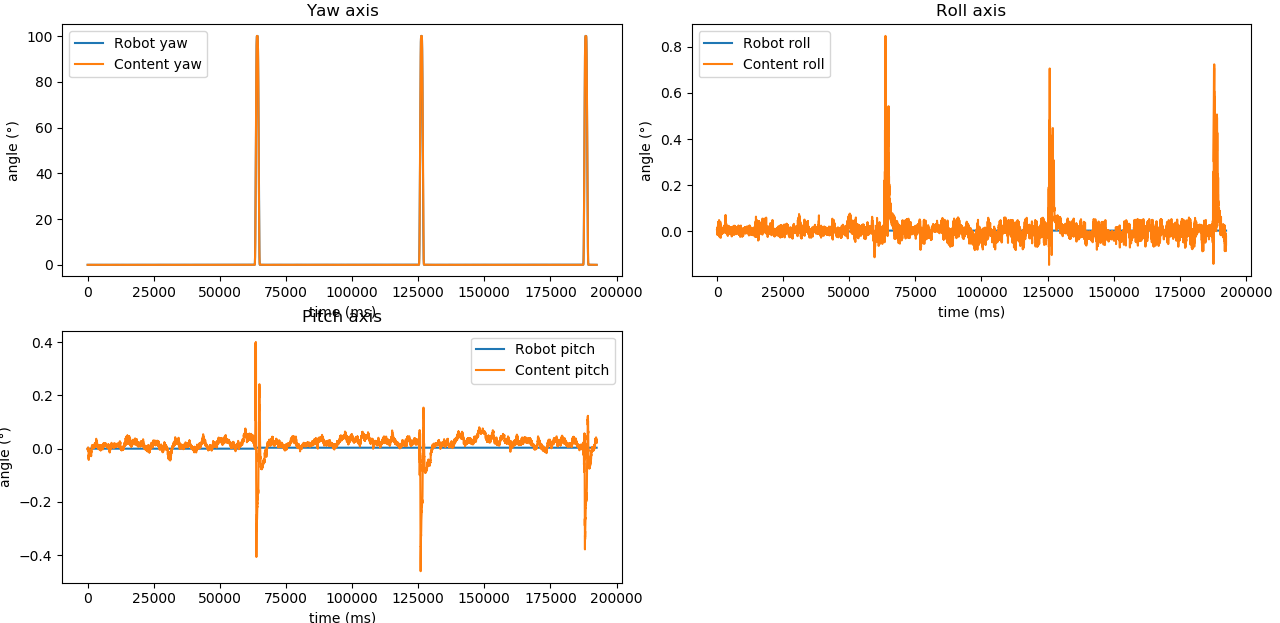
Figure 13: Valve Index
Motion-to-photon (M2P) latency
M2P latency is the main factor in causing motion sickness for the user. Today latencies below 5ms are considered acceptable in VR and near 0ms latencies the same for AR. Latency was measured by moving the robot along each axis separately and comparing the pose to the content.
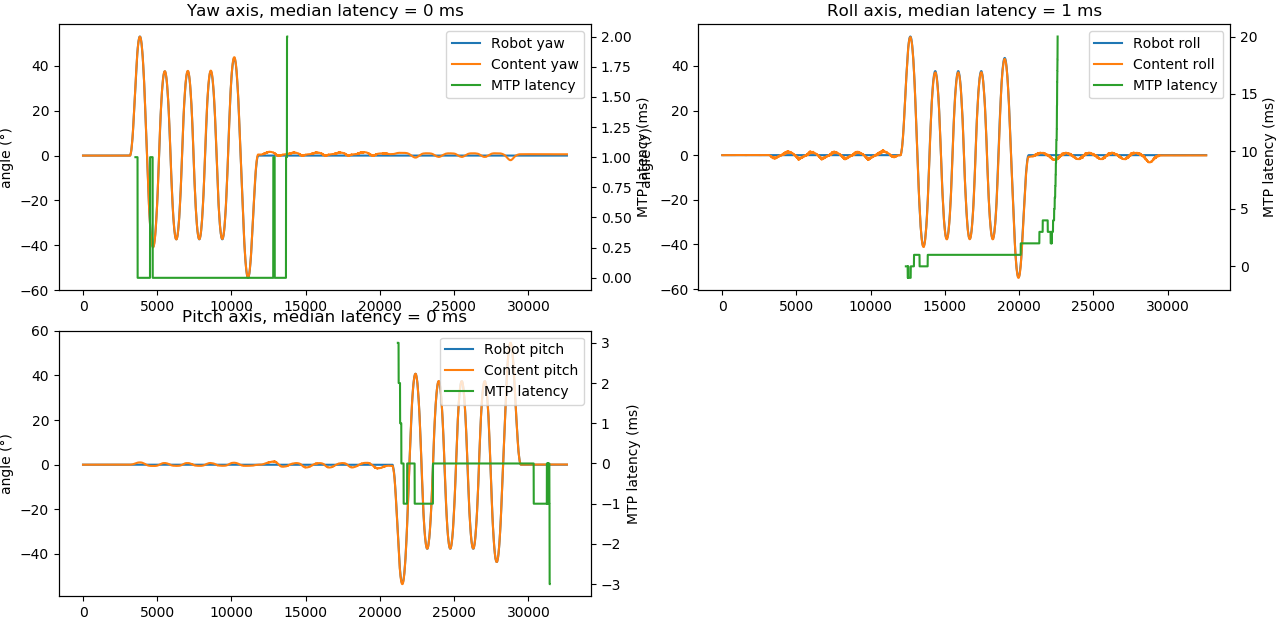
Figure 14: Sony PSVR
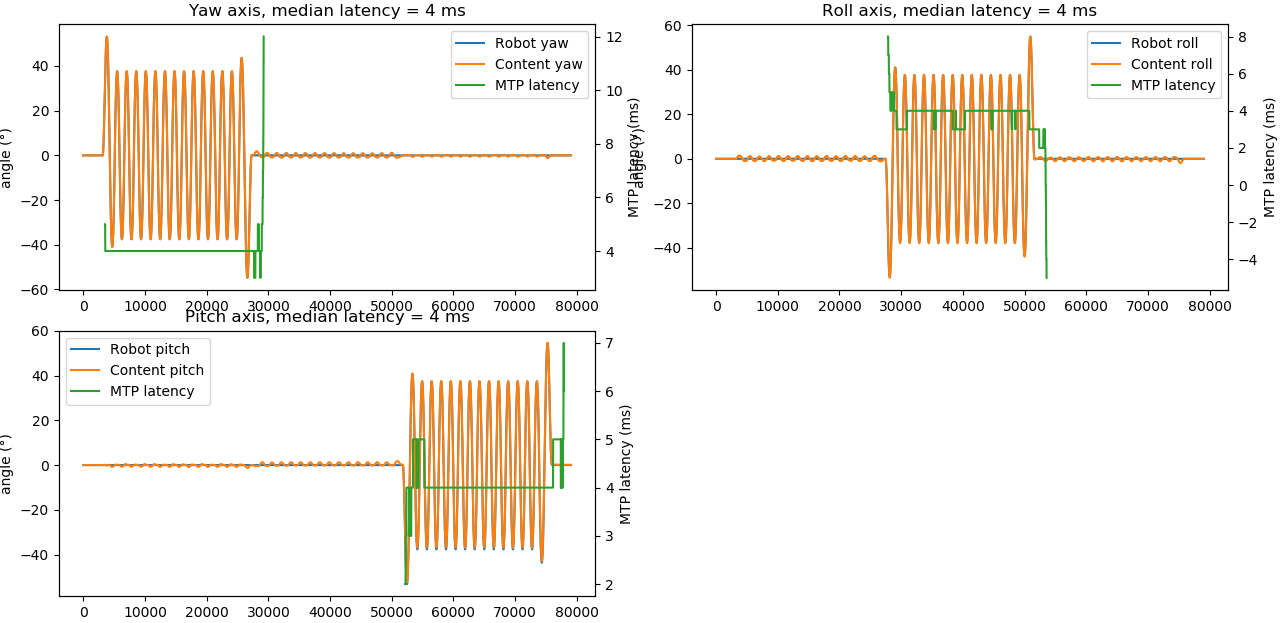
Figure 15: HTC Vive
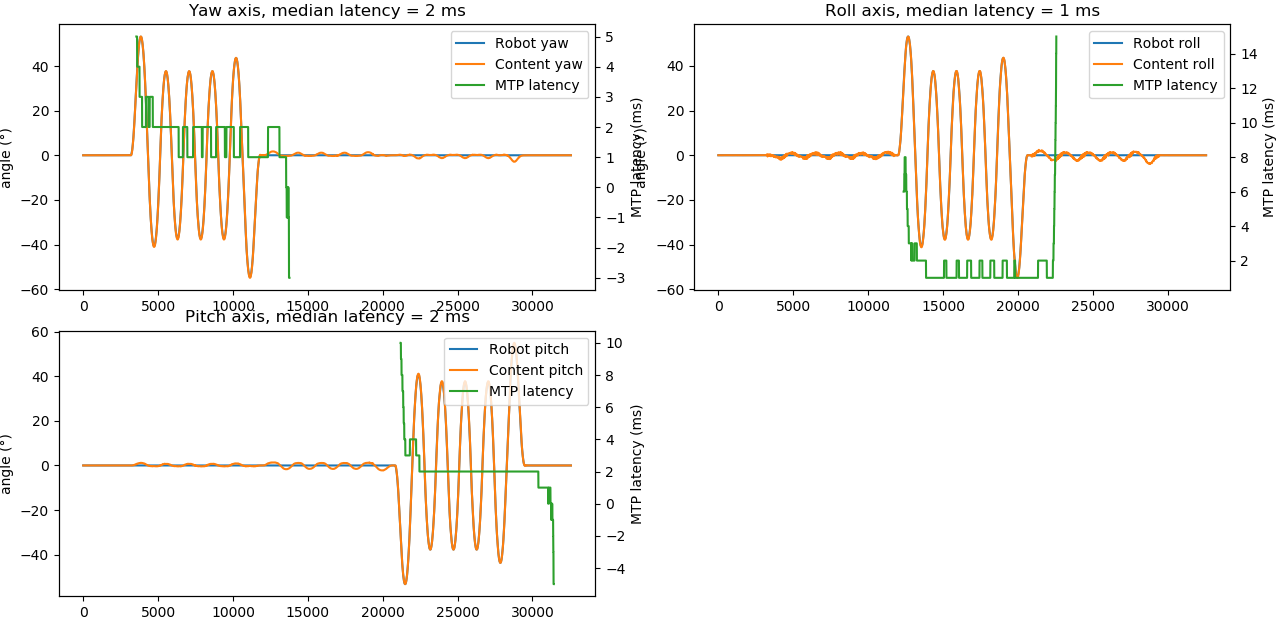
Figure 16: Oculus Quest
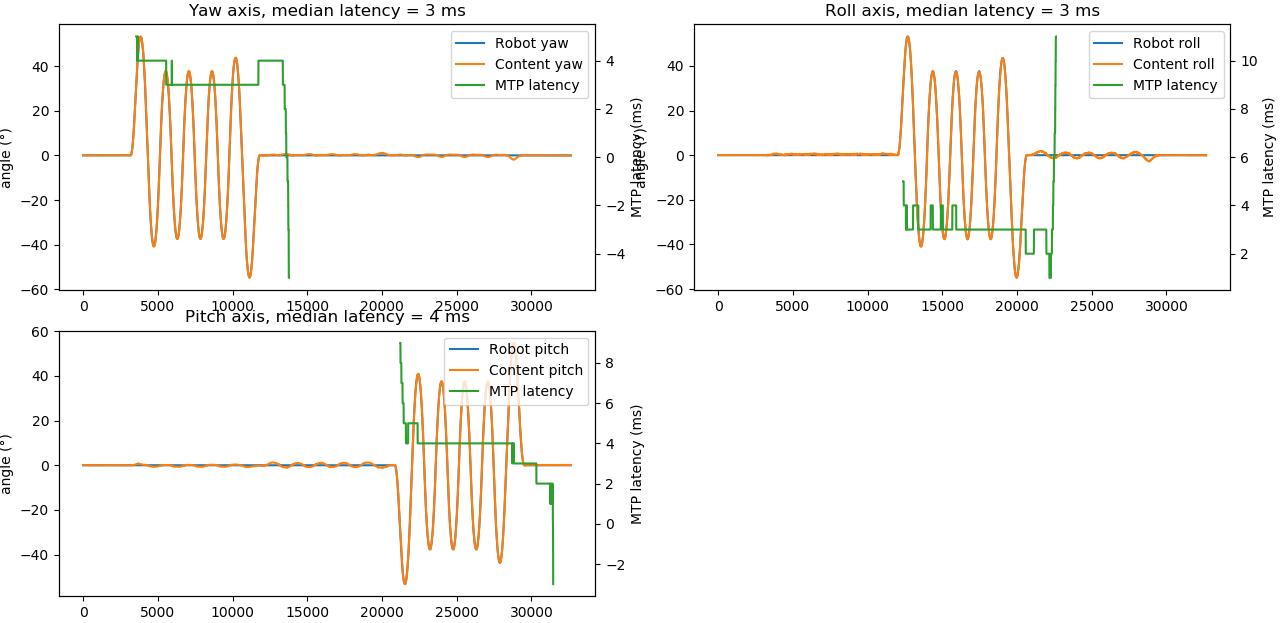
Figure 17: Valve Index
Tracking
General tracking performance measurement was done by moving all the robot axes simultaneously and calculating the difference between the encoder data and rendered content image in the headset.
![]()
Figure 18: Sony PSVR
![]()
Figure 19: HTC Vive
![]()
Figure 20: Oculus Quest
![]()
Figure 21: Valve Index
Summary
The general tracking and latency performance have developed a lot since the first VR equipment was introduced to the market. Even though the tracking accuracy and latency differences between HMD models seem very small, they might have a huge effect on the immersion and possibly cause motion sickness to the user. PSVR seems to stand its ground in terms of tracking performance against its newer competitors. As mentioned earlier, it is or has been mostly the content and ecosystem that drives Sony’s PSVR sales. However, sales figures do not tell the actual utilization rates of these purchased devices, especially in the VR market.
In the coming years, a growing number of devices will rely on an external computing unit for signal processing and image rendering. Be it cloud or the mobile phone in your pocket, the data transfer will be a big factor in the tracking performance.
We at OptoFidelity are committed to help the AR/VR industry develop and build the best devices for the market! If you have any questions or feedback, please do not hesitate to contact us, and our experts in our US, EU and APAC offices will support you.
References:
1: https://www.wired.com/2016/04/magic-leap-vr/
2: https://mp.weixin.qq.com/s/6ysEyBG1ik8c34SB6jMXpw
3: https://www.statista.com/statistics/671403/global-virtual-reality-device-shipments-by-vendor/
4: https://www.viar360.com/virtual-reality-market-size-2018/


